
Cost of Production and Break Even Price Analysis
The average budgeted unit Cost of Production (before interest), and Break Even Price (after interest), calculated from 2023/24 client budgets for the major commodities is shown below:
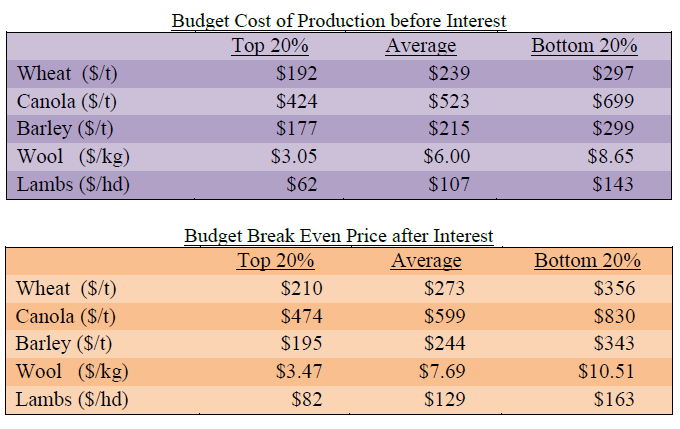
The Cost of Production (COP) and Break Even Prices (BEP) have risen significantly since the last published data for 2021/22 client budgets. Both the COP and BEP prices are significantly greater for clients in the bottom 20% than those in the top 20%. This highlights the producers who effectively allocate inputs to achieve their economic production potential.
Caution is required in interpreting these figures, as no two businesses are the same and the sample size is relatively small for comparison purposes. However, the figures do show what is achieved by some clients, plus the extent of their comparative advantage in a competitive marketplace, both locally and globally.
As a result of the three previous, very wet seasons, many growers have increased budgeted input requirements, particularly fertiliser, (Phosphorous and Nitrogen) plus chemicals (pre-emergent herbicides and fungicides), as nutrients have been removed in the export of grain and lost through leaching, while weeds and disease inoculum have built up significantly due to the conducive growing conditions. In most sheep enterprises, shearing expenses have dramatically increased due to the shortage of shearers.
The top 20% of producers continue to have both lower variable and fixed unit costs than the bottom 20%, due to higher productivity, increased scale diluting overhead costs and better matching of variable costs to expected output.
The challenge to management is to achieve a Cost of Production which provides sufficient margin from expected commodity returns. The suggested target margin is at least 25% of expected returns, which at current commodity prices and input costs, will be very difficult for many clients to achieve.
Therefore, if the net local silo return for wheat is $300/tonne, the desired Cost of Production is $225/tonne or less. For lambs, if $150/head net is obtained, the Cost of Production needs to be $112/head or less to achieve a 25% margin on sales.
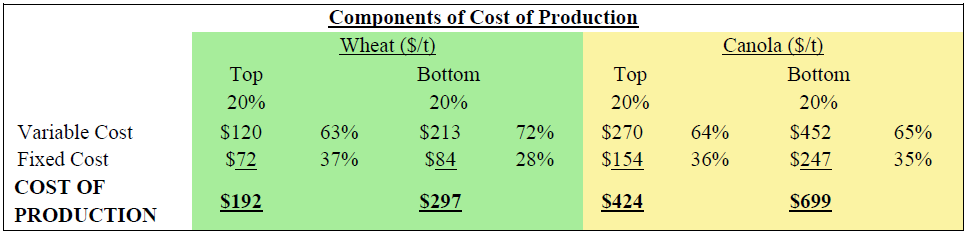
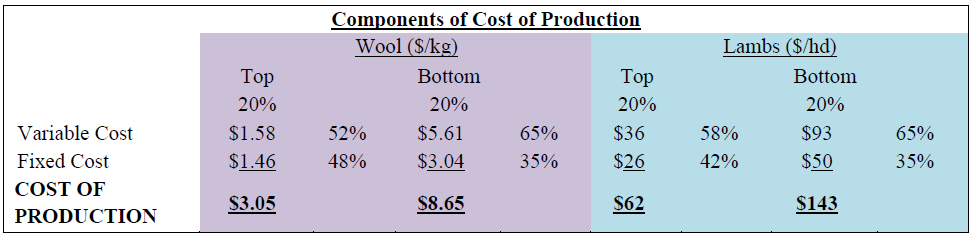
The unit Cost of Production for the top 20% of wheat and canola producers, is around 65% and 60% respectively of that for the bottom 20% of producers, while the unit Cost of Production for the top 20% of wool and lamb producers, is about 35% and 43% respectively of that for the bottom 20% of these producers.
The top 20% of client producers, based on Break Even Price, tend to have lower interest costs per unit of output, along with lower variable and fixed costs compared with the bottom 20% of producers.
An example of the differences in unitised variable and fixed costs between the top 20% and bottom 20% of producers (ranked by Cost of Production), is illustrated in the following table:
The budgeted costs for the top 20% and bottom 20% of clients ranked by Total Costs per Hectare are as follows:

The average total costs of $540/ha for the top 20% of clients ranked on total costs per hectare, is 30% less than the overall average of $771/ha.
The average interest cost of $44/ha for the top 20% of clients ranked on total costs per hectare, is 43% of the overall average of $102/ha. The average interest cost per hectare for the top 20% has increased by only 183% over the last 12 months, while the average interest cost per hectare has increased by 208%.
Clients in the top 20% of costs in general, run very lean, smaller operations with less debt compared to the average client. These businesses have been less impacted by the increase in interest rates, which reduces their total costs in comparison to the average client. This client group are also very responsive to negative changes in trading conditions and can limit financial losses through reduced expenditure. However, this cohort may not have benefited as much as those clients who have expanded and taken advantage, of recent high capital growth in land values and above average production years.