
Net Farm Income Analysis
The results of budgeted Net Farm Income per hectare, for both the top 20% of clients plus average for the group, ranked on Net Farm Income per Hectare is shown below:
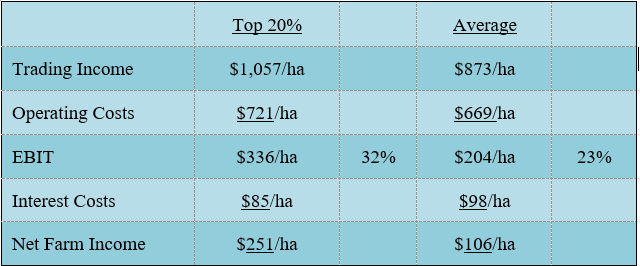
The $145/ha difference between the top 20% and the average cohort shown above, is a very stark demonstration of the differences between farming operations. It also outlines how some businesses can continue to expand and invest in their operation while others are having to source additional working capital.
The figures above illustrate the importance of having highly productive operational systems with costs appropriate for realistic expected output, not necessarily the lowest costs in absolute terms. It is important to have the capacity to take advantage of positive seasonal conditions and maximise productivity when possible.
The top 20% of growers, while having the highest costs in comparison to the average cohort, generate much greater income. This generates the significantly higher EBIT margin which leads to not only greater profitability, but also a lower risk profile. This is due to the top 20% of growers spending 9% less than the average client to generate the same level of income. The challenge for high income, high-cost businesses, is to manage expenditure in lower production years to maintain a high level of profitability.