
Key Financial Ratios (2016/17)

Management should focus on costs rather than income, is the key message from the following analysis.
Some key indicators based on predicted EBIT (earnings before interest and tax) have been calculated on the 2016/17 client budget data. EBIT is a measure of profitability used across various businesses and industries.
The average results for both the top 20% of clients plus average for the client group, ranked on Return on Assets, along with the desired range are as follows:
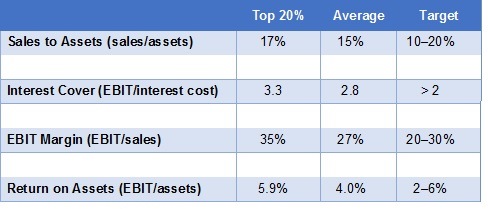
It is interesting to observe that the top 20% of clients ranked on Return on Assets, are at the top end of the target range, while the group average is very close to the midpoint of the target range.
The first ratio is a measure of operating efficiency and capital utilisation, the second a measure of debt servicing ability (comfort factor), while the last two are a measure of profitability. EBIT Margin is also a reflection of the risk profile of the business, with a high figure representing low costs relative to income.
The results above show that the top performing clients can achieve financial ratios comparable to other medium-to-large businesses outside agriculture.
This table reinforces that costs are the biggest driver of risk and profitability, plus Return on Assets, as there is little difference between the Sales/Asset ratio of the two groups. Lower risk and greater profitability is depicted by the significantly higher EBIT Margin for the group having the highest Return on Assets.
The top 20% of clients ranked on Return on Assets have 22% more capital employed in their business than average, which is a reflection of them having an effective area managed of 36% higher than average. This top 20% have Gross Farm Income 39% higher than average, while Operating Costs are only 21% higher than average, leading to their EBIT being 83% higher than average in absolute terms. This illustrates the benefit of scale in diluting fixed costs.